
Dear Shareholders,
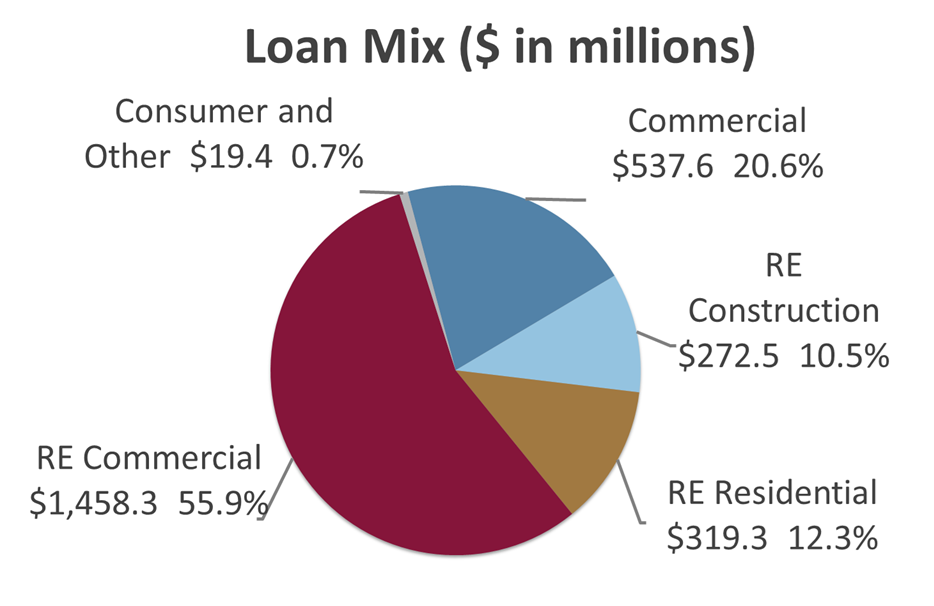
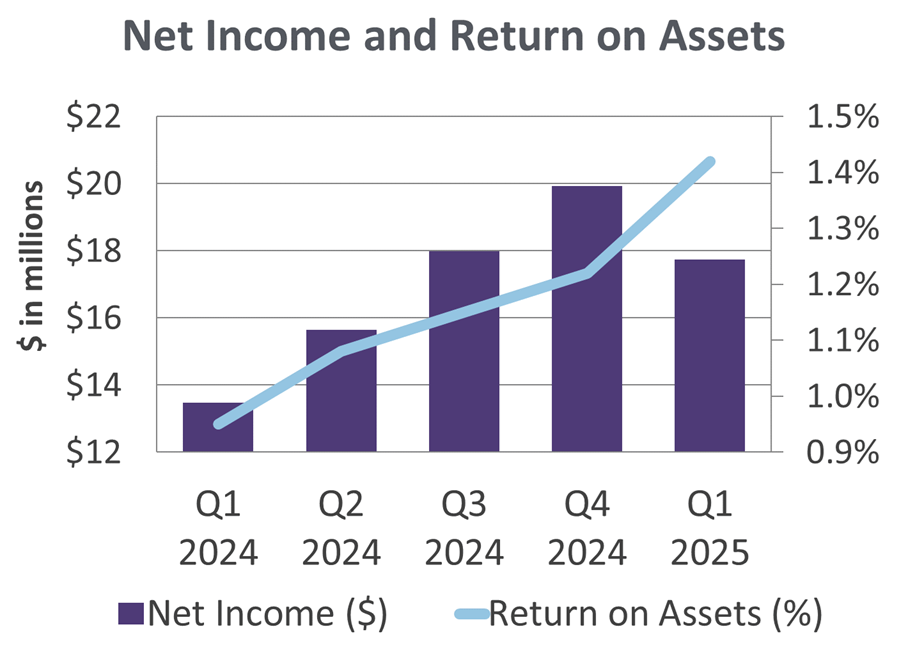
Our strong performance in 2024 carried right over to the first quarter of 2025 as net income grew 31.6% to $17.7 million from $13.5 million during the same period in 2024. Total net interest and loan fee income grew to $44.0 million, $5.7 million higher than the same period in 2024, primarily driven by loan growth and improving net interest margin.
First quarter total interest and loan fee income decreased $3.5 million compared to the first quarter 2024 primarily due to repaying all borrowings in 2024, reducing earning assets. Total interest expense for the quarter decreased $9.2 million compared to the first quarter 2024 without interest incurred on borrowed funds.
Total assets as of March 31 totaled $4.9 billion, $322.9 million lower than prior year without Bank Term Funding Program borrowings. Return on assets for the first quarter of 2025 increased to 1.42% compared to 95 basis points for the first quarter of 2024 on strong net income performance.
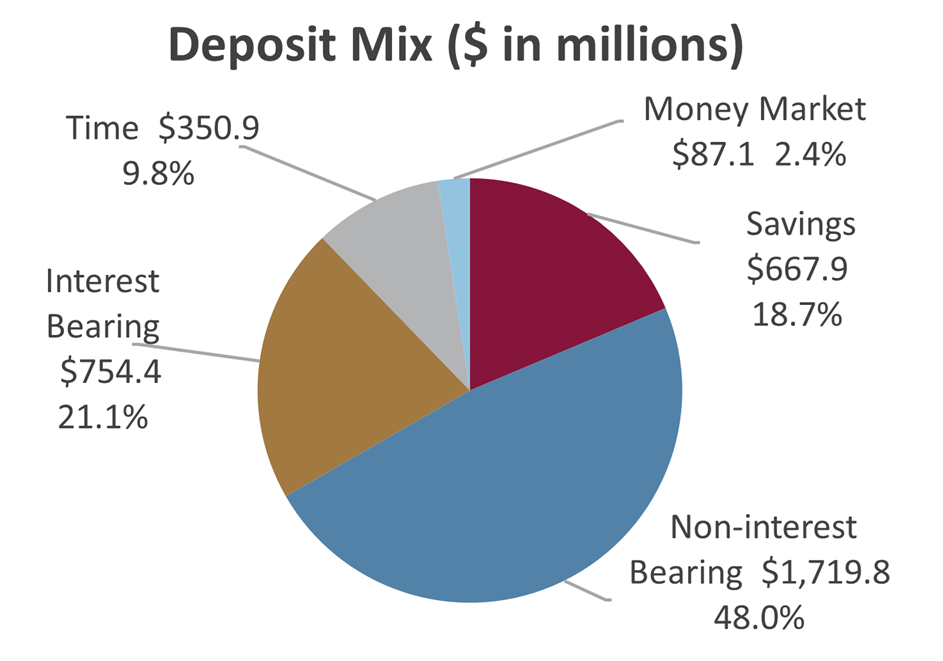
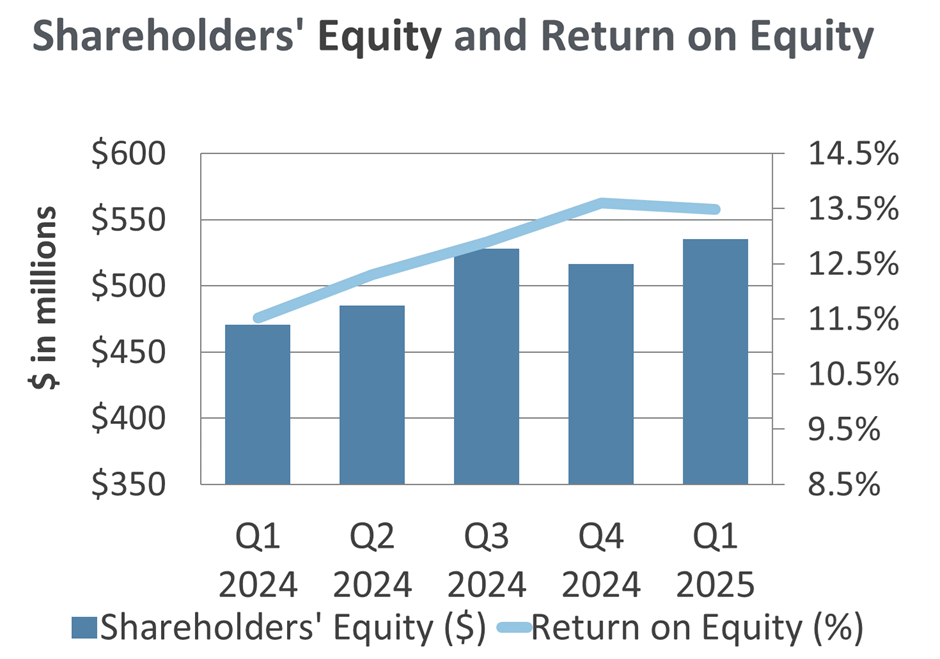
Deposits and repurchase agreements totaled $4.3 billion as of March 31, $60.5 million higher than prior year. Shareholders’ equity at March 31 increased to $535.1 million on retained net income and decreasing unrealized loss position in the securities portfolio. Return on equity improved to 13.49% compared to 11.52% for the same period last year.
The momentum gained last year was evident in 2025 as well. Forbes named First National the sixth best bank in the nation on its annual list of America’s Best Banks. Newsweek also recognized the bank as one of the nation’s Best Regional Banks and Credit Unions. These accolades only confirm that the First National team, more than 600 strong, are committed to shaping a brighter future for our customers, our employees, and our shareholders.
Financial Overview (Unaudited)
Quarter Ended ($ in thousands)
Balance Sheet
| wdt_ID | wdt_created_by | wdt_created_at | wdt_last_edited_by | wdt_last_edited_at | 3/31/2025 | 12/31/2024 | 9/30/2024 | 6/30/2024 | 3/31/2024 | |
|---|---|---|---|---|---|---|---|---|---|---|
| 1 | Total Assets | $4,890,081 | $4,997,767 | $5,557,306 | $5,116,066 | $5,212,976 | ||||
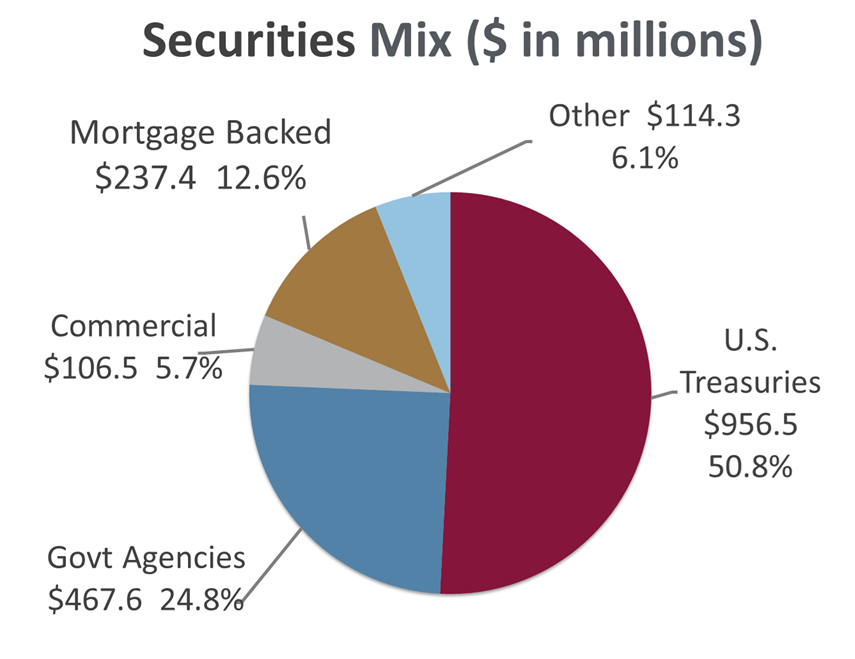
| 2 | Total Securities | $1,882,332 | $1,928,625 | $2,602,519 | $2,197,788 | $2,404,078 | ||||
| 3 | Total Loans | $2,607,081 | $2,469,935 | $2,445,596 | $2,391,593 | $2,369,282 | ||||
| 4 | Total Deposits | $3,580,147 | $3,679,155 | $3,728,181 | $3,698,631 | $3,665,066 | ||||
| 5 | Repurchase Agreements | $716,908 | $743,193 | $647,043 | $615,096 | $571,463 | ||||
| 6 | Total Deposits and Repurchase Agreements | $4,297,055 | $4,422,348 | $4,375,224 | $4,313,727 | $4,236,529 | ||||
| 7 | Total Borrowing under Federal Bank Credit Facilities | $15,000 | $15,000 | $604,868 | $264,868 | $445,000 | ||||
| 8 | Unrealized Loss on Marketable Securities, Net of Tax | $(49,465) | $(62,985) | $(52,020) | $(86,857) | $(95,809) | ||||
| 9 | Total Shareholders' Equity | $535,148 | $516,562 | $527,864 | $485,167 | $470,702 |
Income Statement
| wdt_ID | wdt_created_by | wdt_created_at | wdt_last_edited_by | wdt_last_edited_at | 3/31/2025 | 12/31/2024 | 9/30/2024 | 6/30/2024 | 3/31/2024 | |
|---|---|---|---|---|---|---|---|---|---|---|
| 1 | Interest and Fees on Loans | $41,150 | $41,273 | $41,886 | $39,260 | $37,105 | ||||
| 2 | Interest and Dividends on Investment Securities | $11,150 | $17,392 | $18,808 | $13,683 | $16,437 | ||||
| 3 | Interest on Cash and Cash Equivalents | $3,563 | $4,597 | $3,727 | $3,650 | $5,835 | ||||
| 4 | Total Interest and Loan Fee Income | $55,863 | $63,262 | $64,421 | $56,593 | $59,377 | ||||
| 5 | Total Interest Expense | $11,956 | $18,591 | $21,319 | $16,521 | $21,168 | ||||
| 6 | Provision for Credit Losses | $1,535 | $(118) | $(432) | $318 | $953 | ||||
| 7 | Total Noninterest Operating Income | $6,910 | $7,178 | $7,487 | $7,361 | $6,457 | ||||
| 8 | Net Gains on Investment Securities | $- | $10 | $- | $208 | $199 | ||||
| 9 | Total Noninterest Expense | $25,334 | $27,696 | $25,928 | $25,637 | $25,085 | ||||
| 10 | Provision for Income Taxes | $6,214 | $4,350 | $7,099 | $6,039 | $5,351 | ||||
| 11 | Net Income | $17,734 | $19,931 | $17,994 | $15,647 | $13,476 | ||||
| 12 | Earnings per Common Share | $5.60 | $6.29 | $5.68 | $4.94 | $4.26 | ||||
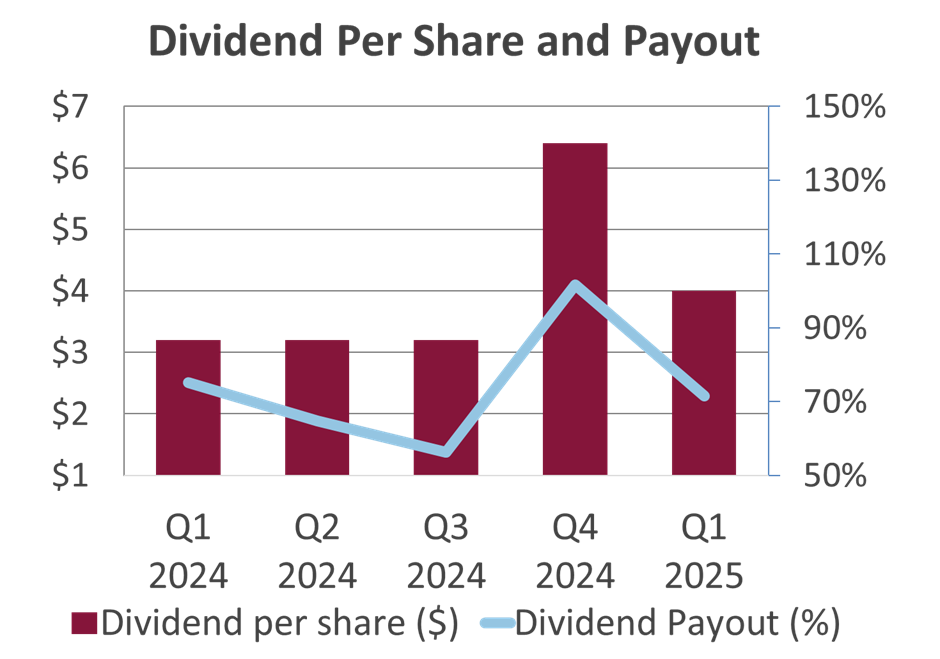
| 13 | Dividend per Common Share | $4.00 | $6.40 | $3.20 | $3.20 | $3.20 |
Financial Measures
| wdt_ID | wdt_created_by | wdt_created_at | wdt_last_edited_by | wdt_last_edited_at | 3/31/2025 | 12/31/2024 | 9/30/2024 | 6/30/2024 | 3/31/2024 | |
|---|---|---|---|---|---|---|---|---|---|---|
| 1 | Return on Assets | 1.42% | 1.22% | 1.15% | 1.08% | 0.95% | ||||
| 2 | Return on Equity | 13.49% | 13.60% | 12.90% | 12.30% | 11.52% | ||||
| 3 | Net Interest Margin | 3.63% | 3.12% | 3.04% | 2.98% | 2.76% | ||||
| 4 | Interest Income to Average Earning Assets | 4.61% | 4.57% | 4.51% | 4.40% | 4.28% | ||||
| 5 | Interest Expense to Average Earning Assets | 0.98% | 1.45% | 1.47% | 1.42% | 1.52% | ||||
| 6 | Efficiency Ratio | 49.70% | 53.51% | 53.59% | 54.94% | 56.00% |
Capital
| wdt_ID | wdt_created_by | wdt_created_at | wdt_last_edited_by | wdt_last_edited_at | wdtcolumn | 3/31/2025 | 12/31/2024 | 9/30/2024 | 6/30/2024 | 3/31/2024 |
|---|---|---|---|---|---|---|---|---|---|---|
| 1 | Shareholders' Equity/Total Assets | 10.94% | 10.34% | 9.50% | 9.48% | 9.03% | ||||
| 2 | Tier 1 Leverage Ratio | 11.72% | 10.54% | 10.39% | 11.12% | 9.96% | ||||
| 3 | Regulatory Well Capitalized Minimum Ratio - Tier 1 Leverage Ratio | 5.00% | 5.00% | 5.00% | 5.00% | 5.00% | ||||
| 4 | Tier 1 (Core) Capital | $584,613 | $579,547 | $579,884 | $572,024 | $566,511 |
Credit Quality
| wdt_ID | wdt_created_by | wdt_created_at | wdt_last_edited_by | wdt_last_edited_at | 3/31/2025 | 12/31/2024 | 9/30/2024 | 6/30/2024 | 3/31/2024 | |
|---|---|---|---|---|---|---|---|---|---|---|
| 1 | Nonperforming Loans and OREO | $4,243 | $4,313 | $4,186 | $4,731 | $28,634 | ||||
| 2 | Nonperforming Loans and OREO/Total Loans | 0.16% | 0.17% | 0.17% | 0.20% | 1.21% | ||||
| 3 | Nonperforming Loans and OREO/Tier 1 Capital | 0.73% | 0.74% | 0.72% | 0.83% | 5.05% | ||||
| 4 | Allowance for Loan Losses | $19,500 | $18,025 | $18,550 | $19,000 | $18,800 | ||||
| 5 | Allowance for Loan Losses/Total Loans | 0.75% | 0.73% | 0.76% | 0.79% | 0.79% |
Net interest margin, yields, and efficiency ratios are tax effected. Financial measures are year-to-date. Per common share amounts are not in thousands.
Looking for more financial information
Call Reports provide quarterly financial highlights and an overview of the bank’s finances, including balance sheets, income statements, financial measures, capital, credit quality, and more.
OTCQX Market
Information about reporting financial misconduct.