
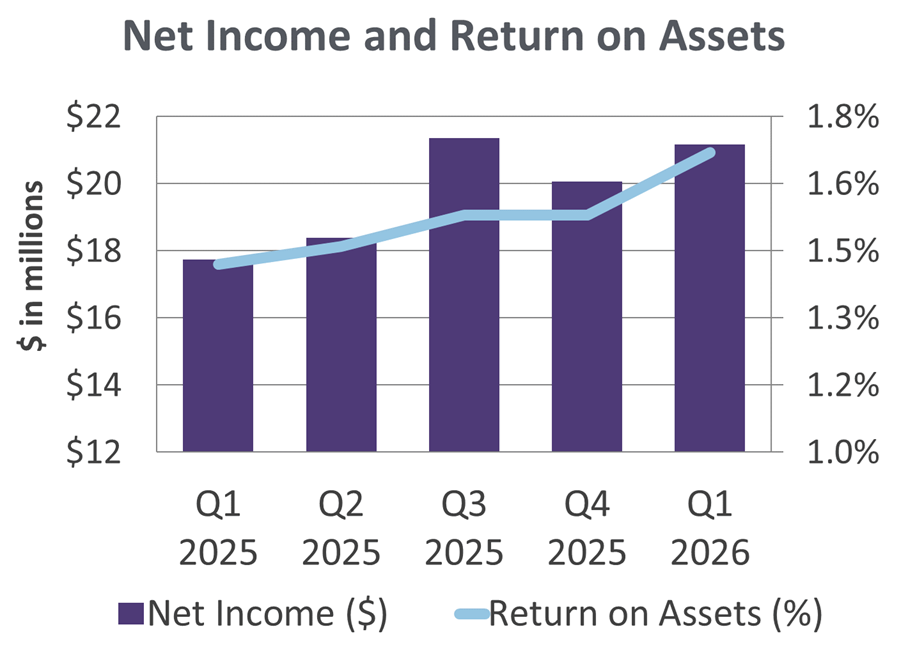
First National Bank Alaska’s (OTCQX:FBAK) net income for the first quarter of 2026 was $21.2 million, or $6.68 per share. This compares to a net income of $17.7 million, or $5.60 per share, for the same period in 2025. Return on assets increased to 1.67%, an improvement of 25 basis points over March 31, 2025, driven by higher net income.
“First National’s strong financial performance in the first quarter reflects continued growth, supported by outstanding financial management and improving core earnings from a stronger asset mix and expanding margins,” said First National Board Chair and CEO/President Betsy Lawer. “This success was reflected in the equity market, as our stock reached new highs and surpassed $1 billion for the first time. I’m proud to work alongside more than 600 Alaskans guided by an exceptionally skilled Board of Directors and leadership team who remain focused on delivering trusted financial services to support communities across Alaska.”
Assets totaled $5.1 billion as of March 31, 2026, an increase of $193.9 million from March 31, 2025, driven by strong deposit growth and retained earnings.
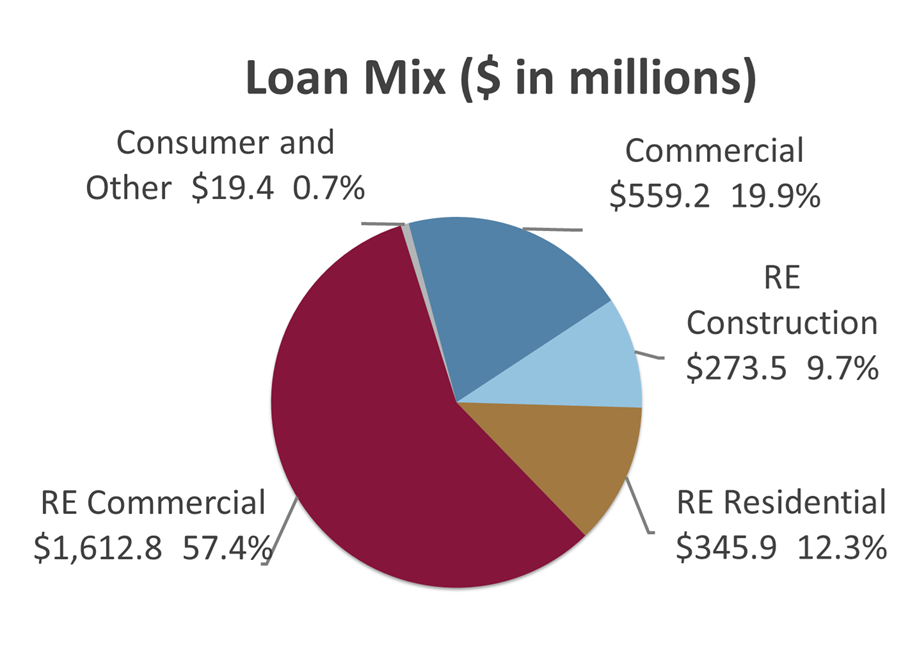
Loans totaled $2.8 billion as of March 31, 2026, an increase of $98.8 million during the first quarter of 2026, and an increase of $203.7 million compared to March 31, 2025. Asset quality remained strong, with nonperforming loans at $12.2 million, or 0.43% of outstanding loans. The provision for credit losses in the first quarter was a benefit of $0.3 million, compared to an expense of $1.5 million in the same period of 2025. The allowance for credit losses as of March 31, 2026, totaled $21.4 million, or 0.76% of total loans.
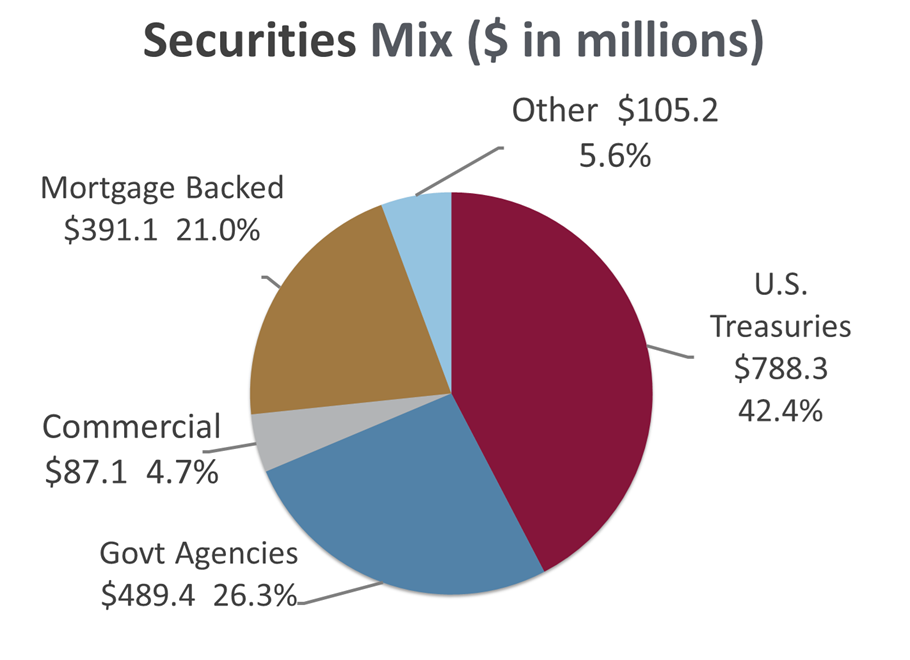
Interest and fees on loans in the first quarter totaled $45.1 million, an increase of $4.0 million, or 9.6%, from $41.1 million in the first quarter of 2025. Interest income on investment securities increased $1.7 million for the quarter ending March 31, 2026, compared to March 31, 2025. Interest income as a percentage of average earning assets increased to 4.87% compared to 4.61% as of March 31, 2025.
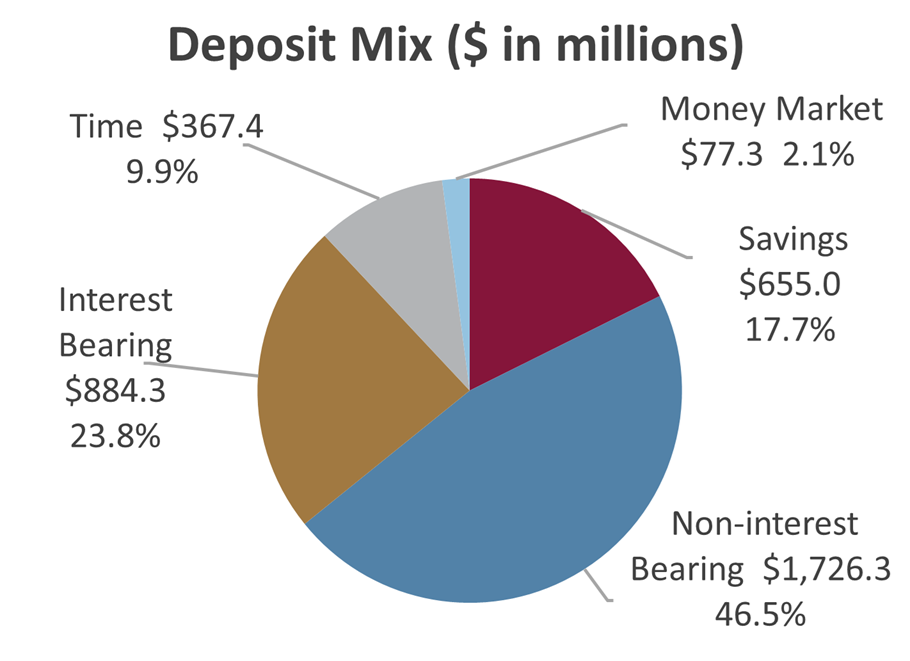
Deposits and repurchase agreements totaled $4.4 billion, an increase of $152.1 million from March 31, 2025. Corresponding interest expense declined by $1 million for the first quarter of 2026, compared to the same period in 2025. Interest expense as a percentage of average earning assets decreased to 89 basis points for the quarter, down from 98 basis points as of March 31, 2025.
Net interest margin increased to 3.98% as of March 31, 2026, up from 3.63% from March 31, 2025, driven by improvements in both yield on earning assets and cost of funds management.
Noninterest operating income for the first quarter of 2026 was $7.0 million, a $0.1 million increase compared to the first quarter of 2025.
Noninterest expenses for the first quarter of 2026 rose by $2.5 million, or 10.1%, primarily due to higher salaries, increased employee headcount, and rising healthcare costs.
The efficiency ratio for March 31, 2026, was 49.81%, comparable to the ratio for March 31, 2025. First National’s management team remained committed to maintaining operating expenses as a percentage of revenue, despite inflation, while enhancing customer systems, business processes, and facilities.
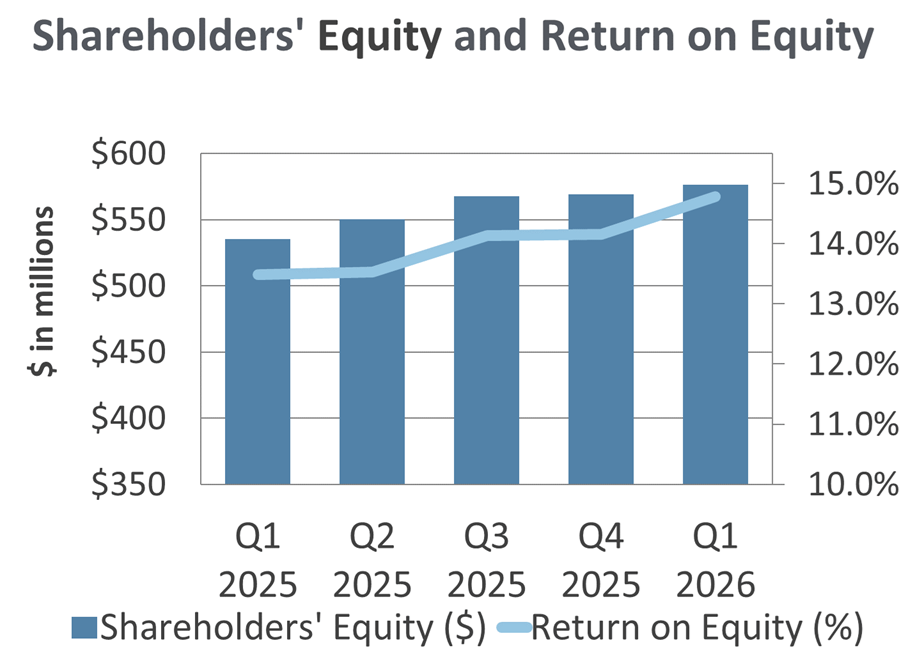
Shareholders’ equity was $576.4 million as of March 31, 2026, compared to $535.1 million as of March 31, 2025. Shareholders’ equity increased by $41.3 million year to date, driven by a reduction in the net unrealized loss position of the securities portfolio and net income retained in excess of dividends paid. Return on equity as of March 31, 2026, was 14.78%, up from 13.49% as of March 31, 2025. Book value per share increased to $182.02, compared to $168.98 as of March 31, 2025. The bank’s Tier 1 leverage capital ratio of 11.90% as of March 31, 2026, remains above well-capitalized standards.
Financial Overview (Unaudited)
Quarter Ended ($ in thousands)
Balance Sheet
| wdt_ID | wdt_created_by | wdt_created_at | wdt_last_edited_by | wdt_last_edited_at | 3/31/2026 | 12/31/2025 | 9/30/2025 | 6/30/2025 | 3/31/2025 | |
|---|---|---|---|---|---|---|---|---|---|---|
| 1 | Total Assets | $5,083,974 | $5,099,945 | $5,243,993 | $4,923,803 | $4,890,081 | ||||
| 2 | Total Securities | $1,861,127 | $1,989,022 | $2,002,118 | $1,859,645 | $1,882,332 | ||||
| 3 | Total Loans | $2,810,797 | $2,711,964 | $2,590,699 | $2,591,713 | $2,607,081 | ||||
| 4 | Total Deposits | $3,710,395 | $3,734,714 | $3,808,022 | $3,586,204 | $3,580,147 | ||||
| 5 | Repurchase Agreements | $738,789 | $739,103 | $804,589 | $731,808 | $716,908 | ||||
| 6 | Total Deposits and Repurchase Agreements | $4,449,184 | $4,473,817 | $4,612,611 | $4,318,012 | $4,297,055 | ||||
| 7 | jwilson | May 11, 2026 04:12 PM | jwilson | May 11, 2026 04:12 PM | Unrealized Gain (Loss) on Marketable Securities, Net of Tax | $(25,812) | $(24,502) | $(31,296) | $(40,193) | $(49,465) |
| 8 | Total Shareholders' Equity | $576,437 | $569,246 | $567,724 | $550,135 | $535,148 |
Income Statement
| wdt_ID | wdt_created_by | wdt_created_at | wdt_last_edited_by | wdt_last_edited_at | 3/31/2026 | 12/31/2025 | 9/30/2025 | 6/30/2025 | 3/31/2025 | |
|---|---|---|---|---|---|---|---|---|---|---|
| 1 | Interest and Fees on Loans | $45,111 | $44,730 | $44,116 | $43,212 | $41,150 | ||||
| 2 | Interest and Dividends on Investment Securities | $12,882 | $14,451 | $12,229 | $10,818 | $11,150 | ||||
| 3 | Interest on Cash and Cash Equivalents | $1,937 | $3,828 | $4,381 | $2,969 | $3,563 | ||||
| 4 | Total Interest and Loan Fee Income | $59,930 | $63,009 | $60,726 | $56,999 | $55,863 | ||||
| 5 | Total Interest Expense | $10,948 | $11,853 | $12,155 | $11,842 | $11,956 | ||||
| 6 | Provision for Credit Losses | $(274) | $2,209 | $436 | $631 | $1,535 | ||||
| 7 | Total Noninterest Operating Income | $6,981 | $7,203 | $7,596 | $7,363 | $6,910 | ||||
| 8 | jwilson | May 11, 2026 04:15 PM | jwilson | May 11, 2026 04:15 PM | Net Gains (Loss) on Investment Securities | $(48) | $- | $- | $- | $- |
| 9 | Total Noninterest Expense | $27,883 | $29,725 | $26,802 | $27,083 | $25,334 | ||||
| 10 | Provision for Income Taxes | $7,137 | $6,362 | $7,570 | $6,423 | $6,214 | ||||
| 11 | Net Income | $21,169 | $20,063 | $21,359 | $18,383 | $17,734 | ||||
| 12 | Earnings per Common Share | $6.68 | $6.33 | $6.75 | $5.80 | $5.60 | ||||
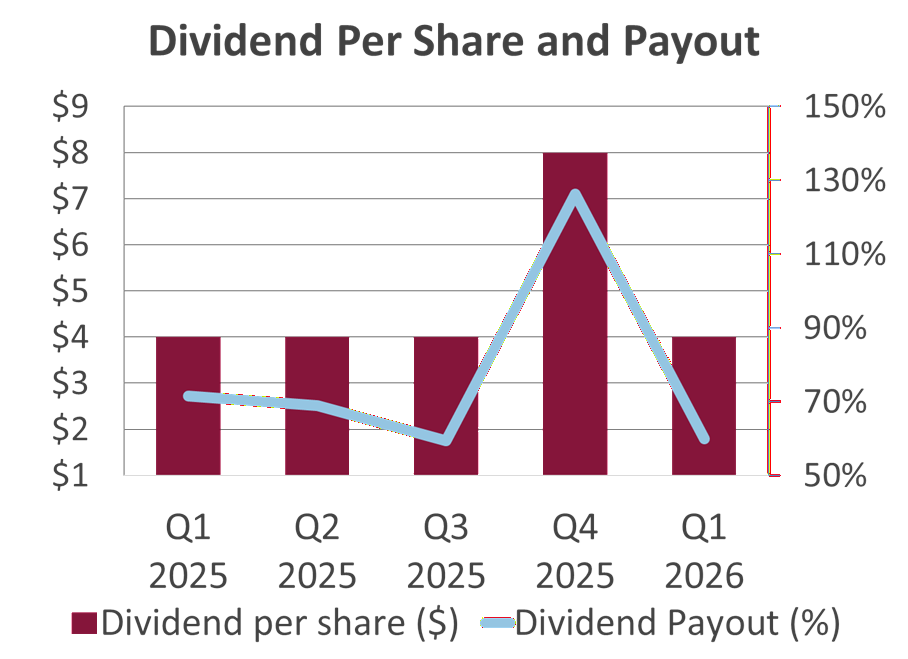
| 13 | Dividend per Common Share | $4.00 | $8.00 | $4.00 | $4.00 | $4.00 |
Financial Measures
| wdt_ID | wdt_created_by | wdt_created_at | wdt_last_edited_by | wdt_last_edited_at | 3/31/2026 | 12/31/2025 | 9/30/2025 | 6/30/2025 | 3/31/2025 | |
|---|---|---|---|---|---|---|---|---|---|---|
| 1 | Return on Assets | 1.67% | 1.53% | 1.53% | 1.46% | 1.42% | ||||
| 2 | Return on Equity | 14.78% | 14.16% | 14.13% | 13.53% | 13.49% | ||||
| 3 | Net Interest Margin | 3.98% | 3.82% | 3.76% | 3.69% | 3.63% | ||||
| 4 | Interest Income to Average Earning Assets | 4.87% | 4.78% | 4.74% | 4.67% | 4.61% | ||||
| 5 | Interest Expense to Average Earning Assets | 0.89% | 0.96% | 0.98% | 0.98% | 0.98% | ||||
| 6 | Efficiency Ratio | 49.81% | 49.86% | 49.52% | 50.58% | 49.70% |
Capital
| wdt_ID | wdt_created_by | wdt_created_at | wdt_last_edited_by | wdt_last_edited_at | 3/31/2026 | 12/31/2025 | 9/30/2025 | 6/30/2025 | 3/31/2025 | |
|---|---|---|---|---|---|---|---|---|---|---|
| 1 | Shareholders' Equity/Total Assets | 11.34% | 11.16% | 10.83% | 11.17% | 10.94% | ||||
| 2 | Tier 1 Leverage Ratio | 11.90% | 11.27% | 11.70% | 11.95% | 11.72% | ||||
| 3 | Regulatory Well Capitalized Minimum Ratio - Tier 1 Leverage Ratio | 5.00% | 5.00% | 5.00% | 5.00% | 5.00% | ||||
| 4 | Tier 1 (Core) Capital | $602,249 | $593,748 | $599,020 | $590,328 | $584,613 |
Credit Quality
| wdt_ID | wdt_created_by | wdt_created_at | wdt_last_edited_by | wdt_last_edited_at | 3/31/2026 | 12/31/2025 | 9/30/2025 | 6/30/2025 | 3/31/2025 | |
|---|---|---|---|---|---|---|---|---|---|---|
| 1 | Nonperforming Loans and OREO | $12,209 | $10,636 | $10,847 | $9,802 | $4,243 | ||||
| 2 | Nonperforming Loans and OREO/Total Loans | 0.43% | 0.39% | 0.42% | 0.38% | 0.16% | ||||
| 3 | Nonperforming Loans and OREO/Tier 1 Capital | 2.03% | 1.79% | 1.81% | 1.66% | 0.73% | ||||
| 4 | Allowance for Loan Losses | $21,400 | $21,450 | $20,100 | $20,025 | $19,500 | ||||
| 5 | Allowance for Loan Losses/Total Loans | 0.76% | 0.79% | 0.78% | 0.77% | 0.75% |
Net interest margin, yields, and efficiency ratios are tax effected. Financial measures are year-to-date. Per common share amounts are not in thousands.
Looking for more financial information
Call Reports provide quarterly financial highlights and an overview of the bank’s finances, including balance sheets, income statements, financial measures, capital, credit quality, and more.
OTCQX Market
Information about reporting financial misconduct.