
Dear Shareholders,
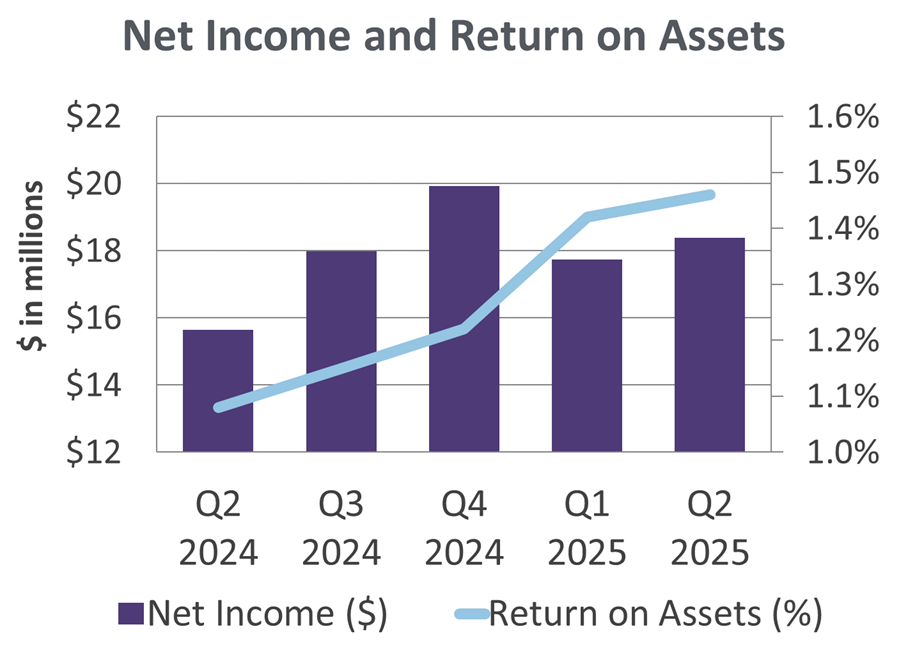
First National continued its positive performance in 2025 with second quarter net income increasing 17.5%, reaching $18.4 million compared to $15.6 million during the same period in 2024. Total net interest and loan fee income grew to $45.2 million, $5.1 million higher than the same period in 2024, primarily driven by loan growth and improving net interest margin.
Second quarter total interest and loan fee income increased $0.4 million compared to the second quarter 2024 primarily due to loan growth, partially offset by repaying all borrowings in 2024, reducing earning assets. Total interest expense for the quarter decreased $4.7 million compared to the second quarter 2024 without interest incurred on borrowed funds along with lower interest expense on deposits in 2025.
Total assets as of June 30 totaled $4.9 billion, $192.3 million lower than prior year without Bank Term Funding Program borrowings. Return on assets for the second quarter of 2025 increased to 1.46% compared to 1.08% for the second quarter of 2024 on strong net income performance.
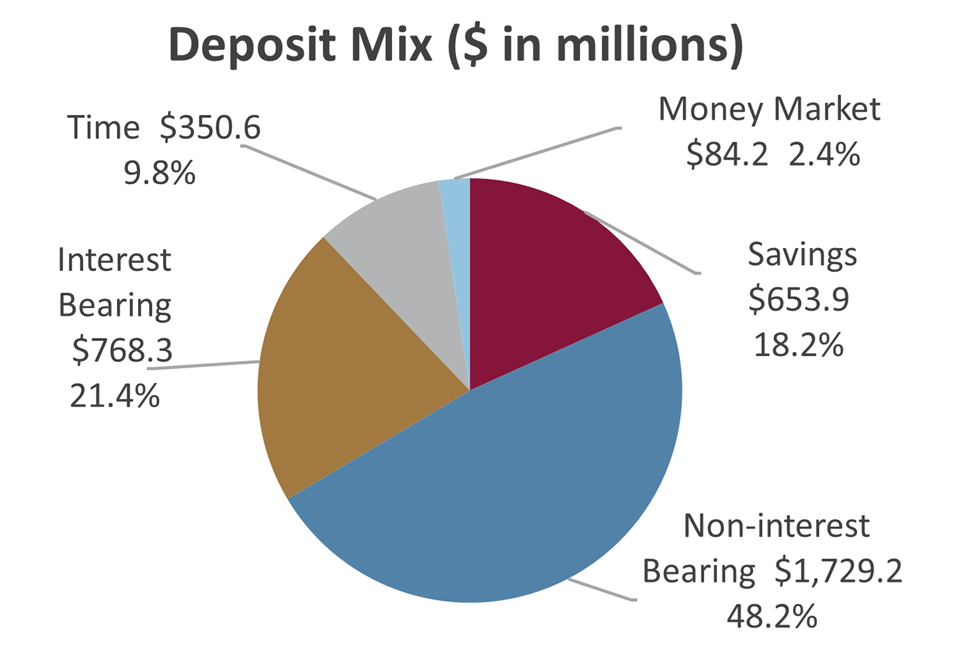
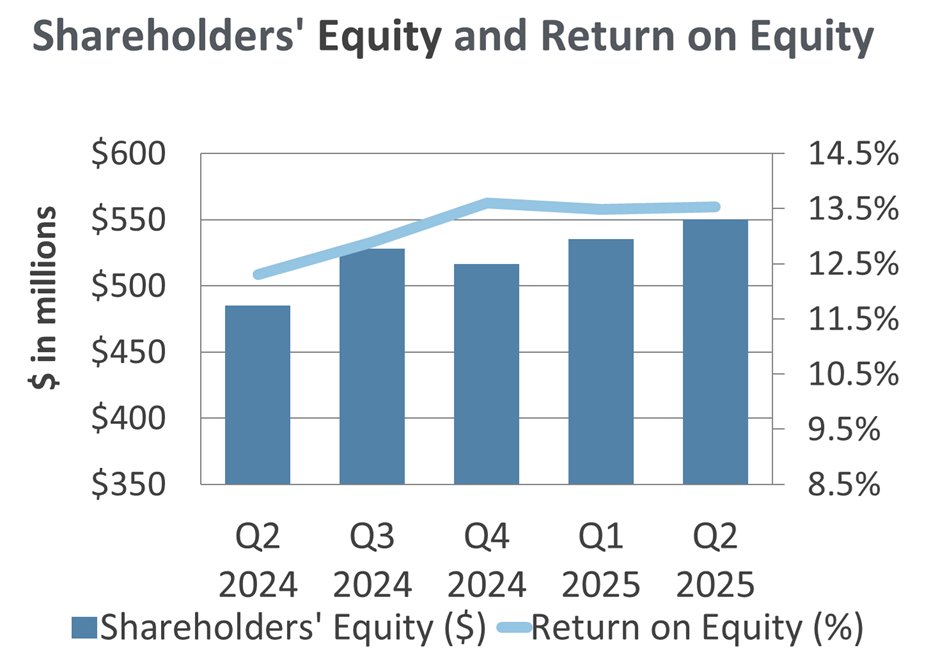
Deposits and repurchase agreements totaled $4.3 billion as of June 30, 2025 and 2024. Shareholders’ equity at June 30 increased to $550.1 million on retained net income and decreasing unrealized loss position in the securities portfolio. Return on equity improved to 13.53% compared to 12.30% for the same period last year.
First National’s mission to “furnish employees with competitive salaries and a pleasant working environment” helped put some nice feathers in our cap recently.
Recognition of our team’s hard work began in the first quarter when Forbes selected First National as the sixth best bank on their America’s Best Banks list and one of the top two Banks in the State, and Newsweek recognized the bank as one of the nation’s Best Regional Banks and Credit Unions.
The kudos continued in the second quarter when Alaska Business readers voted First National “Best of Alaska Business” in the Best Place to Work category for the 10th year in a row, Best Bank/Credit Union for the fifth time, and Best Customer Service for the second year in a row.
This consistent acknowledgement of our 600-plus employees’ efforts to provide excellence in all our operations highlights what executive management and shareholders know well. The value we place on our employees, an essential part of the bank’s culture, is essential to First National’s continued positive performance as we help Alaskans shape a brighter tomorrow.
Financial Overview (Unaudited)
Quarter Ended ($ in thousands)
Balance Sheet
| wdt_ID | wdt_created_by | wdt_created_at | wdt_last_edited_by | wdt_last_edited_at | 6/30/2025 | 3/31/2025 | 12/31/2024 | 9/30/2024 | 6/30/2024 | |
|---|---|---|---|---|---|---|---|---|---|---|
| 1 | Total Assets | $4,923,803 | $4,890,081 | $4,997,767 | $5,557,306 | $5,116,066 | ||||
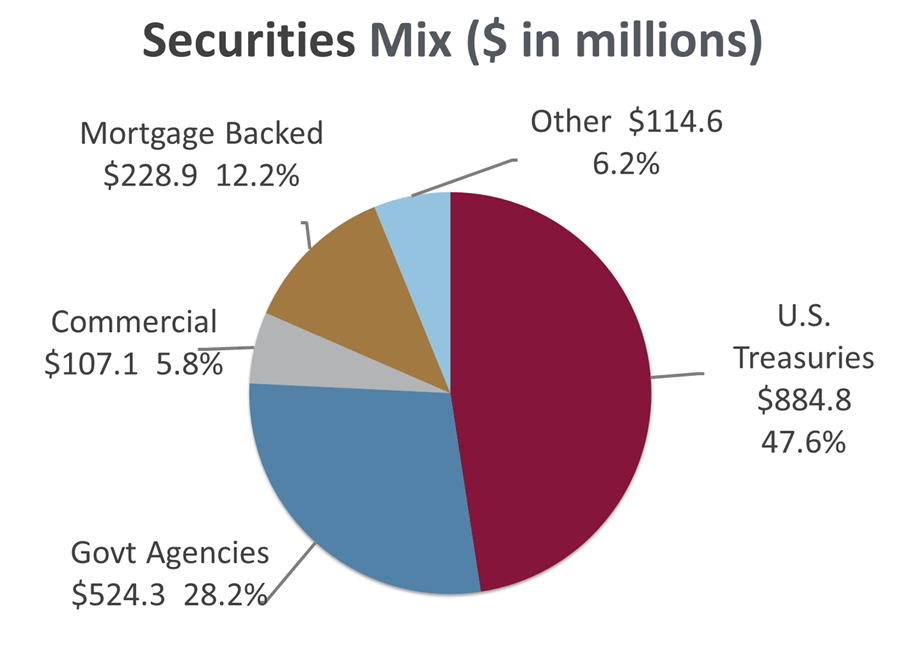
| 2 | Total Securities | $1,859,645 | $1,882,332 | $1,928,625 | $2,602,519 | $2,197,788 | ||||
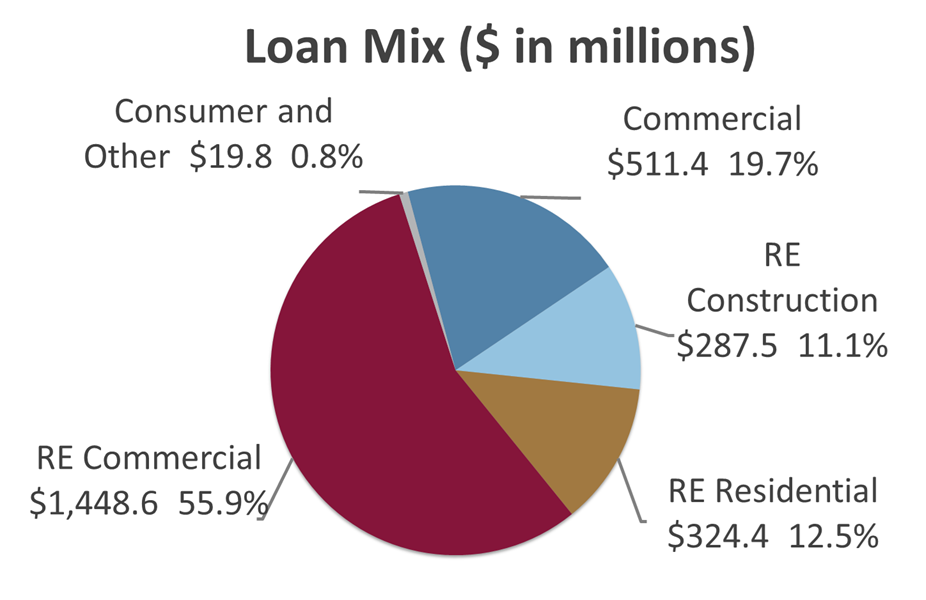
| 3 | Total Loans | $2,591,713 | $2,607,081 | $2,469,935 | $2,445,596 | $2,391,593 | ||||
| 4 | Total Deposits | $3,586,204 | $3,580,147 | $3,679,155 | $3,728,181 | $3,698,631 | ||||
| 5 | Repurchase Agreements | $731,808 | $716,908 | $743,193 | $647,043 | $615,096 | ||||
| 6 | Total Deposits and Repurchase Agreements | $4,318,012 | $4,297,055 | $4,422,348 | $4,375,224 | $4,313,727 | ||||
| 7 | Total Borrowing under Federal Bank Credit Facilities | $15,000 | $15,000 | $15,000 | $604,868 | $264,868 | ||||
| 8 | Unrealized Loss on Marketable Securities, Net of Tax | $(40,193) | $(49,465) | $(62,985) | $(52,020) | $(86,857) | ||||
| 9 | Total Shareholders' Equity | $550,135 | $535,148 | $516,562 | $527,864 | $485,167 |
Income Statement
| wdt_ID | wdt_created_by | wdt_created_at | wdt_last_edited_by | wdt_last_edited_at | 6/30/2025 | 3/31/2025 | 12/31/2024 | 9/30/2024 | 6/30/2024 | |
|---|---|---|---|---|---|---|---|---|---|---|
| 1 | Interest and Fees on Loans | $43,212 | $41,150 | $41,273 | $41,886 | $39,260 | ||||
| 2 | Interest and Dividends on Investment Securities | $10,818 | $11,150 | $17,392 | $18,808 | $13,683 | ||||
| 3 | Interest on Cash and Cash Equivalents | $2,969 | $3,563 | $4,597 | $3,727 | $3,650 | ||||
| 4 | Total Interest and Loan Fee Income | $56,999 | $55,863 | $63,262 | $64,421 | $56,593 | ||||
| 5 | Total Interest Expense | $11,842 | $11,956 | $18,591 | $21,319 | $16,521 | ||||
| 6 | Provision for Credit Losses | $631 | $1,535 | $(118) | $(432) | $318 | ||||
| 7 | Total Noninterest Operating Income | $7,363 | $6,910 | $7,178 | $7,487 | $7,361 | ||||
| 8 | Net Gains on Investment Securities | $- | $- | $10 | $- | $208 | ||||
| 9 | Total Noninterest Expense | $27,083 | $25,334 | $27,696 | $25,928 | $25,637 | ||||
| 10 | Provision for Income Taxes | $6,423 | $6,214 | $4,350 | $7,099 | $6,039 | ||||
| 11 | Net Income | $18,383 | $17,734 | $19,931 | $17,994 | $15,647 | ||||
| 12 | Earnings per Common Share | $5.80 | $5.60 | $6.29 | $5.68 | $4.94 | ||||
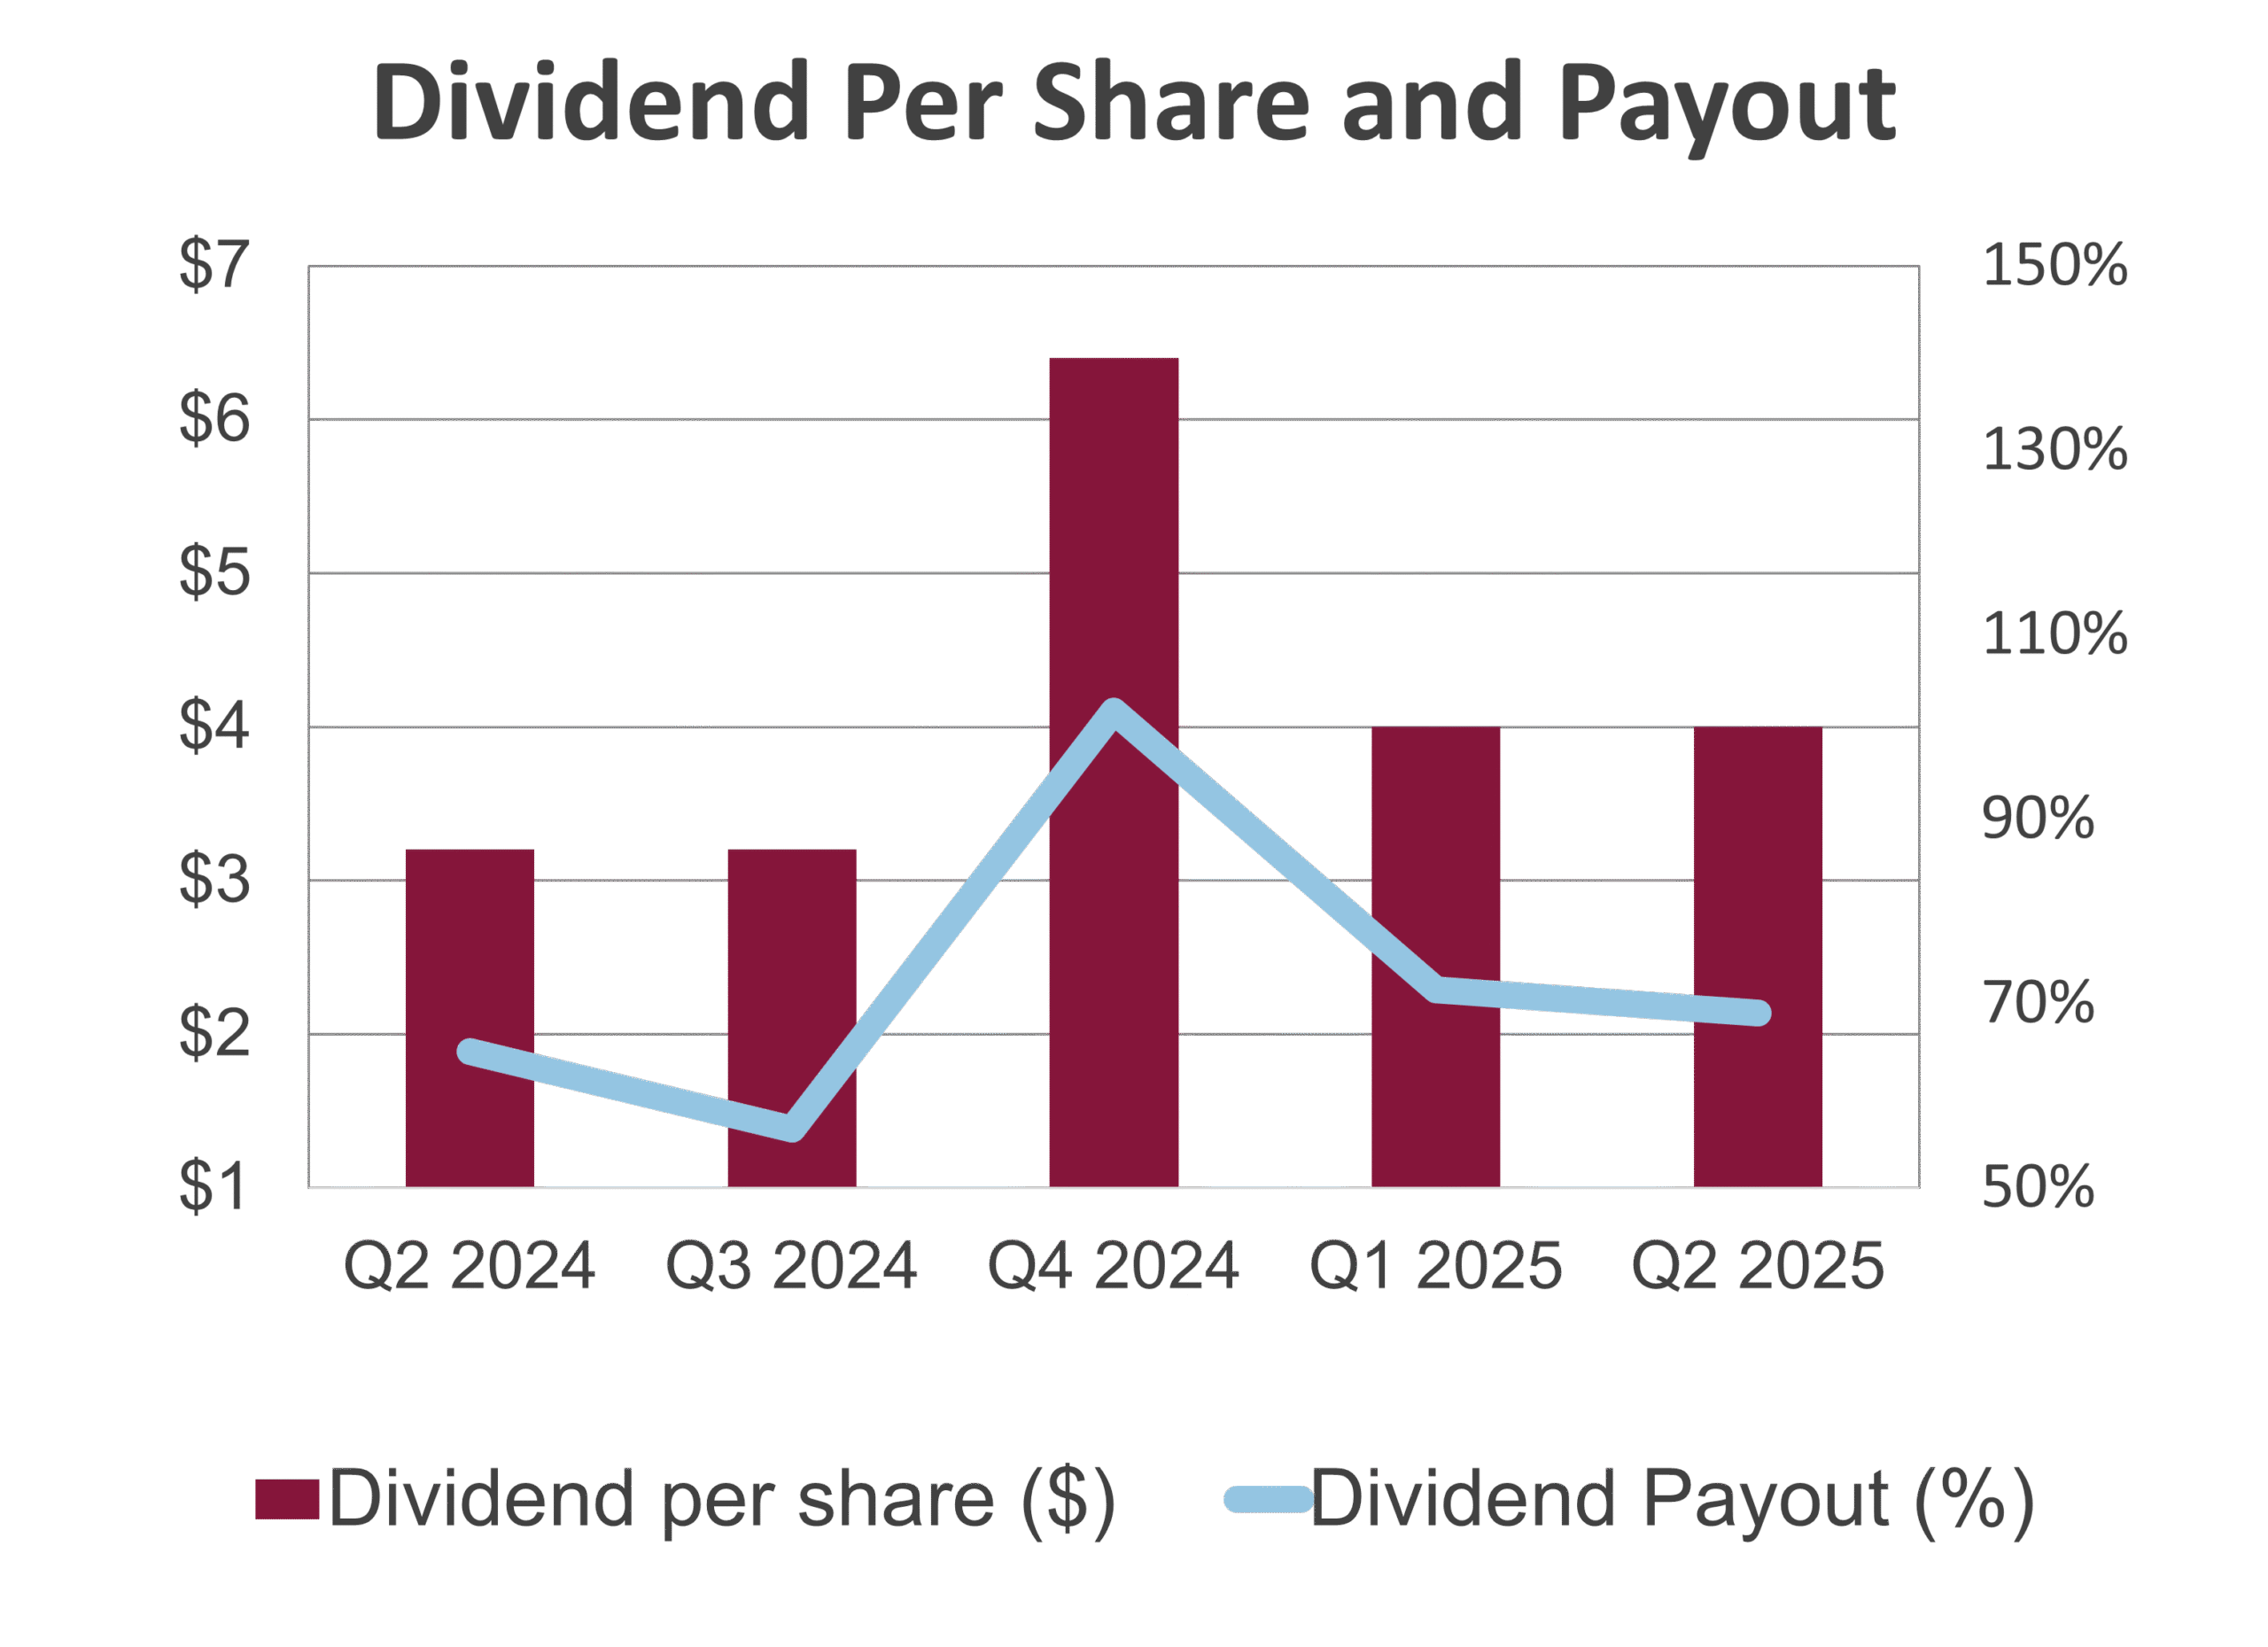
| 13 | Dividend per Common Share | $4.00 | $4.00 | $6.40 | $3.20 | $3.20 |
Financial Measures
| wdt_ID | wdt_created_by | wdt_created_at | wdt_last_edited_by | wdt_last_edited_at | Financials | 6/30/2025 | 3/31/2025 | 12/31/2024 | 9/30/2024 | 6/30/2024 |
|---|---|---|---|---|---|---|---|---|---|---|
| 1 | Return on Assets | 1.46% | 1.42% | 1.22% | 1.15% | 1.08% | ||||
| 2 | Return on Equity | 13.53% | 13.49% | 13.60% | 12.90% | 12.30% | ||||
| 3 | Net Interest Margin | 3.69% | 3.63% | 3.12% | 3.04% | 2.98% | ||||
| 4 | Interest Income to Average Earning Assets | 4.67% | 4.61% | 4.57% | 4.51% | 4.40% | ||||
| 5 | Interest Expense to Average Earning Assets | 0.98% | 0.98% | 1.45% | 1.47% | 1.42% | ||||
| 6 | Efficiency Ratio | 50.58% | 49.70% | 53.51% | 53.59% | 54.94% |
Capital
| wdt_ID | wdt_created_by | wdt_created_at | wdt_last_edited_by | wdt_last_edited_at | Financials | 6/30/2025 | 3/31/2025 | 12/31/2024 | 9/30/2024 | 6/30/2024 |
|---|---|---|---|---|---|---|---|---|---|---|
| 1 | Shareholders' Equity/Total Assets | 11.17% | 10.94% | 10.34% | 9.50% | 9.48% | ||||
| 2 | Tier 1 Leverage Ratio | 11.95% | 11.72% | 10.54% | 10.39% | 11.12% | ||||
| 3 | Regulatory Well Capitalized Minimum Ratio - Tier 1 Leverage Ratio | 5.00% | 5.00% | 5.00% | 5.00% | 5.00% | ||||
| 4 | Tier 1 (Core) Capital | $590,328 | $584,613 | $579,547 | $579,884 | $572,024 |
Credit Quality
| wdt_ID | wdt_created_by | wdt_created_at | wdt_last_edited_by | wdt_last_edited_at | Financials | 6/30/2025 | 3/31/2025 | 12/31/2024 | 9/30/2024 | 6/30/2024 |
|---|---|---|---|---|---|---|---|---|---|---|
| 1 | Nonperforming Loans and OREO | $9,802 | $4,243 | $4,313 | $4,186 | $4,731 | ||||
| 2 | Nonperforming Loans and OREO/Total Loans | 0.38% | 0.16% | 0.17% | 0.17% | 0.20% | ||||
| 3 | Nonperforming Loans and OREO/Tier 1 Capital | 1.66% | 0.73% | 0.74% | 0.72% | 0.83% | ||||
| 4 | Allowance for Loan Losses | $20,025 | $19,500 | $18,025 | $18,550 | $19,000 | ||||
| 5 | Allowance for Loan Losses/Total Loans | 0.77% | 0.75% | 0.73% | 0.76% | 0.79% |
Net interest margin, yields, and efficiency ratios are tax effected. Financial measures are year-to-date. Per common share amounts are not in thousands.
Looking for more financial information
Call Reports provide quarterly financial highlights and an overview of the bank’s finances, including balance sheets, income statements, financial measures, capital, credit quality, and more.
OTCQX Market
Information about reporting financial misconduct.