
Dear Shareholders,
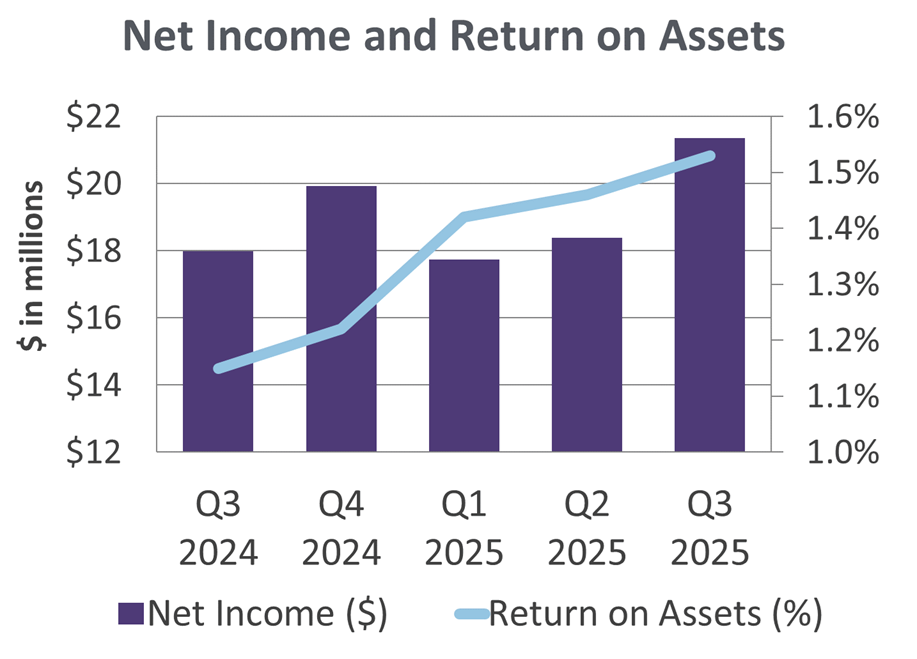
ANCHORAGE, AK – First National Bank Alaska’s (OTCQX:FBAK) net income for the third quarter of 2025 was $21.4 million, or $6.75 per share. This compares to a net income of $18.0 million, or $5.68 per share, for the same period in 2024.
“First National’s 2025 performance demonstrates strong quarterly growth in net income and continued momentum across our key performance ratios,” said First National Board Chair and CEO/President Betsy Lawer. “Teams across the bank focused on strategies that drove loan and deposit growth, improved noninterest income improvement, and kept operating expenses aligned with our customer and operational goals. Return on assets of 1.53% underscores our commitment to high performance amongst our national peer group.”
Total assets increased to $5.2 billion as of Sept. 30, representing a year-to-date increase of $246.2 million with customer deposit and repurchase agreement growth totaling $190.3 million year to date. Assets decreased $313.3 million compared to Sept. 30, 2024, following $590.0 million in borrowing repayments during the fourth quarter of 2024. Return on assets as increased to 1.53% as of Sept. 30, 2025 – thirty-eight basis points higher than the prior year – reflecting strong net income performance in 2025.
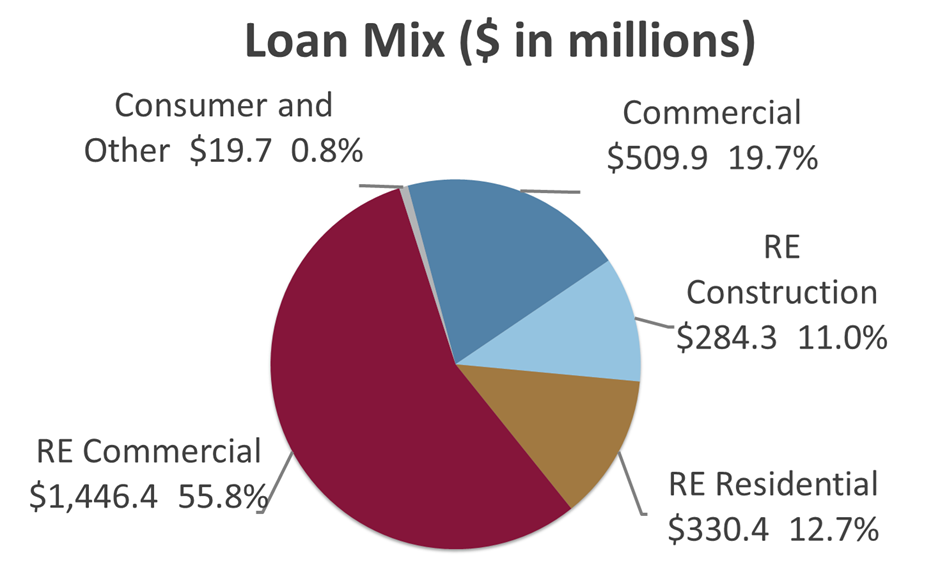
Loans totaled $2.6 billion as of Sept. 30, 2025, an increase of $145.1 million compared to Sept. 30, 2024. Nonperforming loans were $10.8 million, 0.42% of outstanding loans, an increase from Sept. 30, 2024 on nonaccrual loan activity. The third quarter provision for credit losses totaled $0.4 million, compared to a benefit of $0.4 million in third quarter 2024. The year-to-date provision for credit losses totaled $2.6 million on loan growth through Sept. 30, 2025, compared to $0.8 million as of the same date last year. The allowance for credit losses as of Sept. 30, 2025 totaled $20.1 million, or 0.78% of total loans.
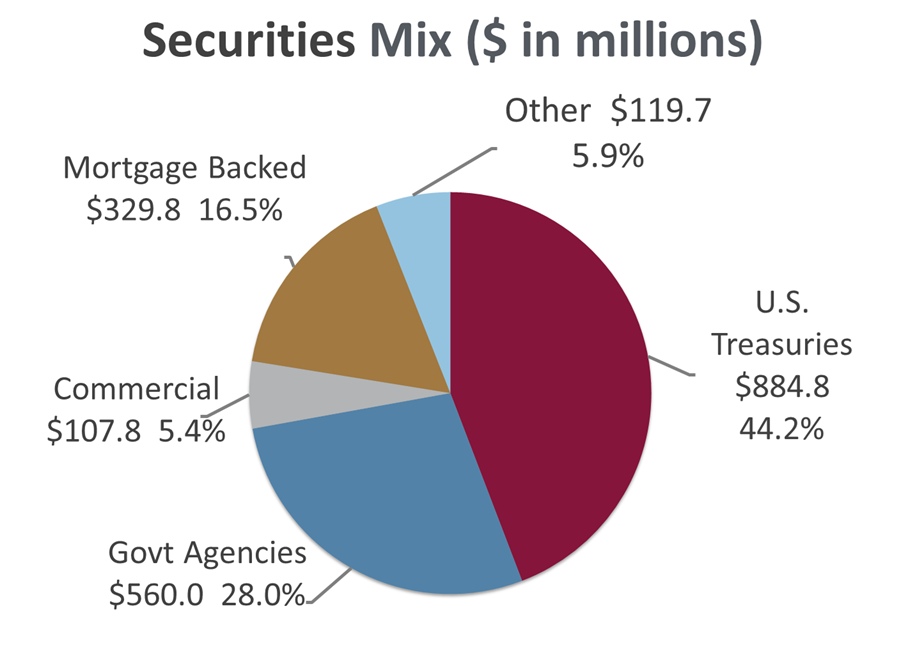
Interest and fees on loans for the third quarter totaled $44.1 million, an increase of $2.2 million, 5.3% over $41.9 million for the third quarter of 2024. Interest income from investment securities decreased $6.6 million for quarter ending Sept. 30, 2025, compared to 2024. Investment income in 2025 does not include supplemental income earned in 2024 on the short-term tactical borrowings. Interest income to average earning assets increased to 4.74% compared to 4.51% for the same period in 2024.
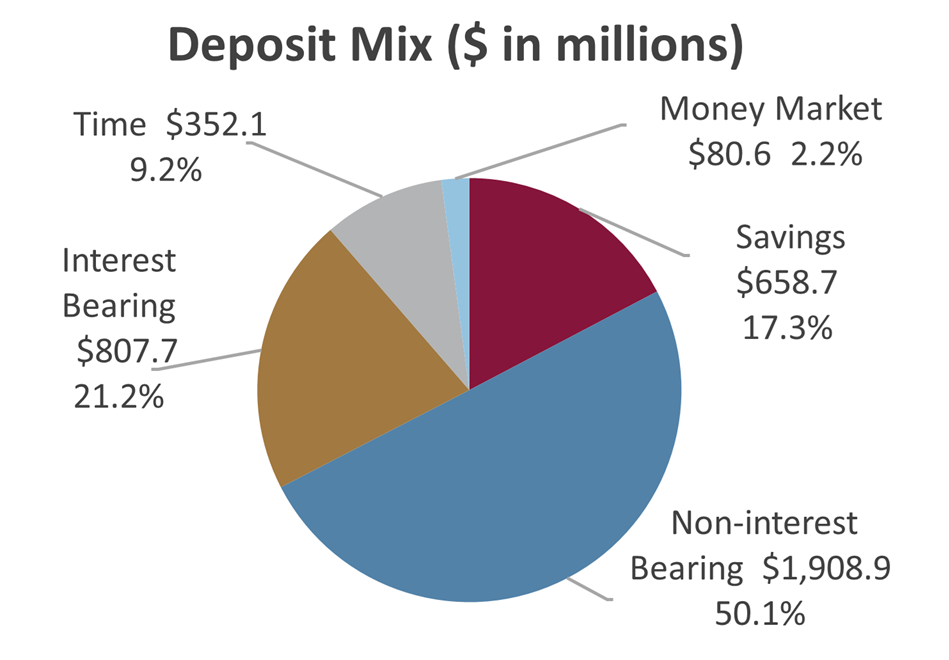
Total interest expense for the third quarter was $12.2 million, a decrease of $9.2 million from $21.3 million compared to the third quarter of 2024, which included $7.7 million in interest on borrowed funds. Deposits and repurchase agreements totaled $4.6 billion as of Sept. 30, 2025, an increase of $237.4 million over the prior year. Corresponding interest expense declined by $1.6 million for the third quarter 2025 as compared to the same period in 2024. Interest expense to average earning assets decreased to ninety-eight basis points compared to 1.47% as of Sept. 30, 2024.
Net interest margin through Sept. 30, 2025 increased to 3.76% compared to 3.04% for Sept. 30, 2024, driven by improved yields on earning assets and effective cost of funds management.
Noninterest operating income for third quarter 2025 was $7.6 million, representing a 1.5% increase from $7.5 million compared to the third quarter of 2024. Noninterest expenses for the same period increased $0.9 million, or 3.4%, compared to the same period in 2024, primarily due to higher salaries and benefits resulting from increased health care costs.
The efficiency ratio for Sept. 30, 2025, was 49.52%, highlighting First National Bank Alaska’s ability to generate strong revenue while maintaining lower operating expenses than both Alaska and national peers.
Shareholders’ equity reached $567.7 million as of Sept. 30, 2025, compared to $527.9 million as of Sept. 30, 2024. This $51.2 million year-to-date increase was driven by retained net income and a reduction in unrealized losses in the securities portfolio. Return on equity improved to 14.13%, compared to 12.90% as of Sept. 30, 2024. Book value per share increased to $179.27, compared to $166.68 as of Sept. 30, 2024. The bank’s Tier 1 leverage capital ratio of 11.70% remains above well-capitalized standards.
Financial Overview (Unaudited)
Quarter Ended ($ in thousands)
Balance Sheet
| wdt_ID | wdt_created_by | wdt_created_at | wdt_last_edited_by | wdt_last_edited_at | 9/30/2025 | 6/30/2025 | 3/31/2025 | 12/31/2024 | 9/30/2024 | |
|---|---|---|---|---|---|---|---|---|---|---|
| 1 | Total Assets | $5,243,993 | $4,923,803 | $4,890,081 | $4,997,767 | $5,557,306 | ||||
| 2 | Total Securities | $2,002,118 | $1,859,645 | $1,882,332 | $1,928,625 | $2,602,519 | ||||
| 3 | Total Loans | $2,590,699 | $2,591,713 | $2,607,081 | $2,469,935 | $2,445,596 | ||||
| 4 | Total Deposits | $3,808,022 | $3,586,204 | $3,580,147 | $3,679,155 | $3,728,181 | ||||
| 5 | Repurchase Agreements | $804,589 | $731,808 | $716,908 | $743,193 | $647,043 | ||||
| 6 | Total Deposits and Repurchase Agreements | $4,612,611 | $4,318,012 | $4,297,055 | $4,422,348 | $4,375,224 | ||||
| 7 | Total Borrowing under Federal Bank Credit Facilities | $15,000 | $15,000 | $15,000 | $15,000 | $604,868 | ||||
| 8 | Unrealized Loss on Marketable Securities, Net of Tax | $(31,296) | $(40,193) | $(49,465) | $(62,985) | $(52,020) | ||||
| 9 | Total Shareholders' Equity | $567,724 | $550,135 | $535,148 | $516,562 | $527,864 |
Income Statement
| wdt_ID | wdt_created_by | wdt_created_at | wdt_last_edited_by | wdt_last_edited_at | 9/30/2025 | 6/30/2025 | 3/31/2025 | 12/31/2024 | 9/30/2024 | |
|---|---|---|---|---|---|---|---|---|---|---|
| 1 | Interest and Fees on Loans | $44,116 | $43,212 | $41,150 | $41,273 | $41,886 | ||||
| 2 | Interest and Dividends on Investment Securities | $12,229 | $10,818 | $11,150 | $17,392 | $18,808 | ||||
| 3 | Interest on Cash and Cash Equivalents | $4,381 | $2,969 | $3,563 | $4,597 | $3,727 | ||||
| 4 | Total Interest and Loan Fee Income | $60,726 | $56,999 | $55,863 | $63,262 | $64,421 | ||||
| 5 | Total Interest Expense | $12,155 | $11,842 | $11,956 | $18,591 | $21,319 | ||||
| 6 | Provision for Credit Losses | $436 | $631 | $1,535 | $(118) | $(432) | ||||
| 7 | Total Noninterest Operating Income | $7,596 | $7,363 | $6,910 | $7,178 | $7,487 | ||||
| 8 | Net Gains on Investment Securities | $- | $- | $- | $10 | $- | ||||
| 9 | Total Noninterest Expense | $26,802 | $27,083 | $25,334 | $27,696 | $25,928 | ||||
| 10 | Provision for Income Taxes | $7,570 | $6,423 | $6,214 | $4,350 | $7,099 | ||||
| 11 | Net Income | $21,359 | $18,383 | $17,734 | $19,931 | $17,994 | ||||
| 12 | Earnings per Common Share | $6.75 | $5.80 | $5.60 | $6.29 | $5.68 | ||||
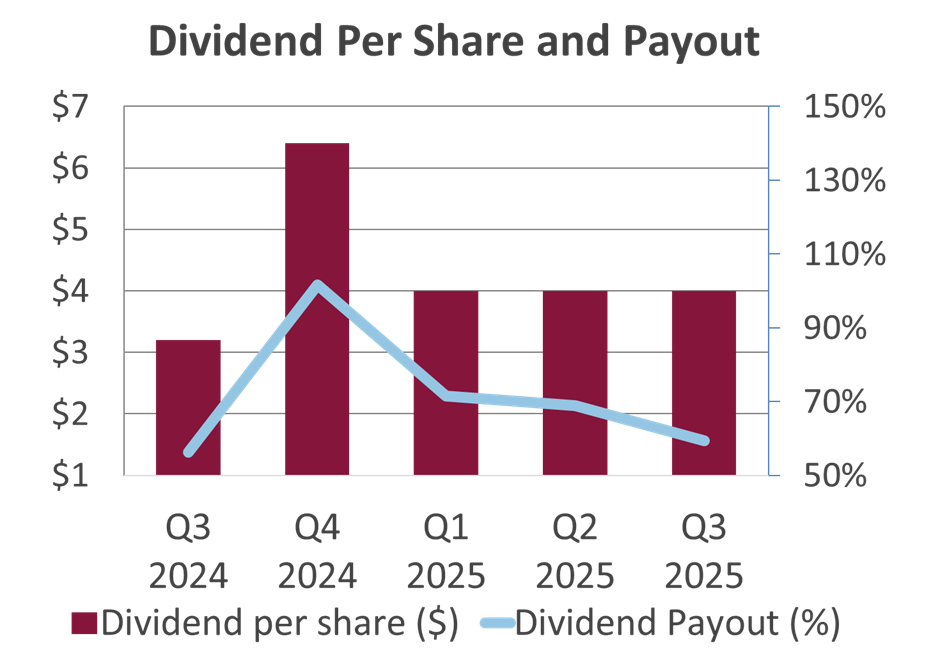
| 13 | Dividend per Common Share | $4.00 | $4.00 | $4.00 | $6.40 | $3.20 |
Financial Measures
| wdt_ID | wdt_created_by | wdt_created_at | wdt_last_edited_by | wdt_last_edited_at | 9/30/2025 | 6/30/2025 | 3/31/2025 | 12/31/2024 | 9/30/2024 | |
|---|---|---|---|---|---|---|---|---|---|---|
| 1 | Return on Assets | 1.53% | 1.46% | 1.42% | 1.22% | 1.15% | ||||
| 2 | Return on Equity | 14.13% | 13.53% | 13.49% | 13.60% | 12.90% | ||||
| 3 | Net Interest Margin | 3.76% | 3.69% | 3.63% | 3.12% | 3.04% | ||||
| 4 | Interest Income to Average Earning Assets | 4.74% | 4.67% | 4.61% | 4.57% | 4.51% | ||||
| 5 | Interest Expense to Average Earning Assets | 0.98% | 0.98% | 0.98% | 1.45% | 1.47% | ||||
| 6 | Efficiency Ratio | 49.52% | 50.58% | 49.70% | 53.51% | 53.59% |
Capital
| wdt_ID | wdt_created_by | wdt_created_at | wdt_last_edited_by | wdt_last_edited_at | 9/30/2025 | 6/30/2025 | 3/31/2025 | 12/31/2024 | 9/30/2024 | |
|---|---|---|---|---|---|---|---|---|---|---|
| 1 | Shareholders' Equity/Total Assets | 10.83% | 11.17% | 10.94% | 10.34% | 9.50% | ||||
| 2 | Tier 1 Leverage Ratio | 11.70% | 11.95% | 11.72% | 10.54% | 10.39% | ||||
| 3 | Regulatory Well Capitalized Minimum Ratio - Tier 1 Leverage Ratio | 5.00% | 5.00% | 5.00% | 5.00% | 5.00% | ||||
| 4 | Tier 1 (Core) Capital | $599,020 | $590,328 | $584,613 | $579,547 | $579,884 |
Credit Quality
| wdt_ID | wdt_created_by | wdt_created_at | wdt_last_edited_by | wdt_last_edited_at | 9/30/2025 | 6/30/2025 | 3/31/2025 | 12/31/2024 | 9/30/2024 | |
|---|---|---|---|---|---|---|---|---|---|---|
| 1 | Nonperforming Loans and OREO | $10,847 | $9,802 | $4,243 | $4,313 | $4,186 | ||||
| 2 | Nonperforming Loans and OREO/Total Loans | 0.42% | 0.38% | 0.16% | 0.17% | 0.17% | ||||
| 3 | Nonperforming Loans and OREO/Tier 1 Capital | 1.81% | 1.66% | 0.73% | 0.74% | 0.72% | ||||
| 4 | Allowance for Loan Losses | $20,100 | $20,025 | $19,500 | $18,025 | $18,550 | ||||
| 5 | Allowance for Loan Losses/Total Loans | 0.78% | 0.77% | 0.75% | 0.73% | 0.76% |
Net interest margin, yields, and efficiency ratios are tax effected. Financial measures are year-to-date. Per common share amounts are not in thousands.

Looking for more financial information
Call Reports provide quarterly financial highlights and an overview of the bank’s finances, including balance sheets, income statements, financial measures, capital, credit quality, and more.
OTCQX Market
Information about reporting financial misconduct.